Throw the equity switch!
Article written on 21 April 2023
Equity strategy: Anyone willing to take their Swiss equity investments into their own hands can beat the market over the long term with a relatively simple strategy of switching from one ETF to another. And they can do so without becoming hyperactive.
For long-term investors looking to invest in the Swiss equity market over the next eight to ten years, there is a lucrative equity strategy that invests either in large caps (SMI stocks like Roche, Novartis and Nestle) or mid caps (SMIM stocks like VAT Group, Swatch and Lindt). Sure, you need a bit of investment expertise, but it’s not too complicated. Promise!
Why mid caps?
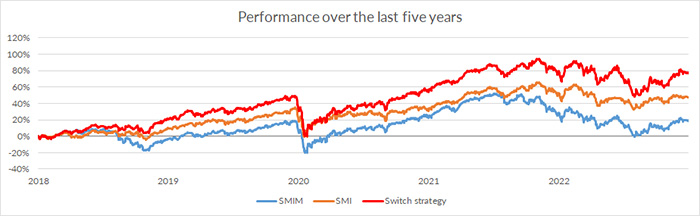
In general, dynamic growth rates in sales and earnings and the chance of being taken over by a larger company are reflected in higher valuations for mid-cap companies. If you look closely at the Swiss equity market over the last ten years, you will see that small and mid-cap stocks have outperformed the tried-and-trusted heavyweights in the SMI by a considerable margin. Including dividends, the SMI returned 99%, while the SMIM managed 142%. Smart investors might think investing permanently in the SMIM would be a rewarding strategy, but a glance at its performance over the last five years is sobering; it managed just 19%, compared to 45% for the SMI. This inevitably raises the question of whether it would be a cunning strategy to divide your equity weighting between the SMI and the SMIM, or to switch completely from the SMI to the SMIM.
A quantitative analysis of the SMI and the SMIM
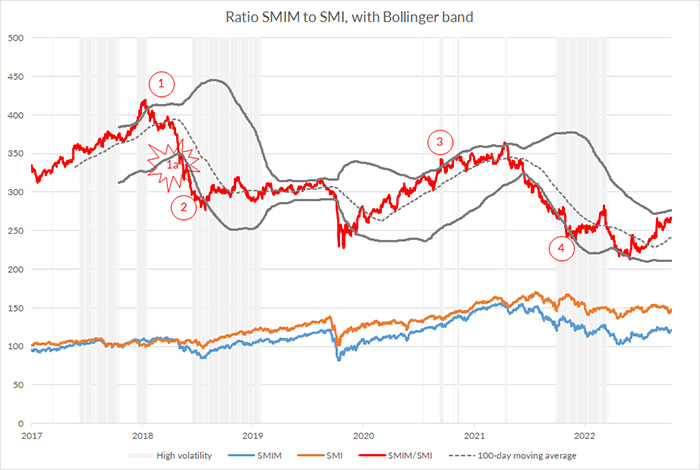
Chart 1 shows in red the relationship between the daily prices of the SMIM and the SMI over the last five years. When the line is going up, it means the SMIM is outperforming the SMI. The grey lines around this relationship show the 200-day Bollinger band, a statistical measurement of the range of the relationship that gives a signal. If the red line breaks through the upper Bollinger band, as shown at point 1, you throw the switch and sell SMIM positions and buy the SMI. Point 2 shows the next switch; this time the Bollinger band is broken to the downside, so you close out SMI positions and buy the SMIM. What happened in 2018? The relationship went down sharply, reflecting underperformance by SMIM stocks, while the SMI was in demand because the Fed was tightening liquidity. From mid-2018 onwards (2) until point 3 in the chart, the strategy remains in the SMIM, sleeping through the Covid tumble in March 2020 but still outperforming the SMI. From point 3 on, we are back in the SMI and switch in good time before inflation and tighter monetary policy spoil the equity party. Since point 4 (October 2022), the strategy has been invested in the SMIM, which was the right decision, as the rising red line indicates. It is worth making one further remark on the chart; it would have been possible to get in and out earlier, but this would have been very unprofitable (1a), so a volatility filter was superimposed on the strategy (the grey bars). Switching is only worth considering in these grey bars.
Implementation with ETFs
Apart from a spreadsheet program like Excel, you need the time series for the SMI and the SMIM, which are available online. There are also endless calculations of the Bollinger band on the internet. Low-cost ETFs on the SMI and SMIM are suitable vehicles to use. High liquidity, tight spreads and full market coverage are just some of the reasons supporting this choice.
Advantages
If you do not have the time and inclination to keep an eye on what are often called “quality stocks” and track earnings and analyst ratings, or have had bad experiences in the past with direct holdings, you should consider the passive switching strategy. It avoids some of the big mistakes investors can make in the equity market: you are always invested, because in the long term only people who follow the market every day should try to be smart and shift their equity allocation between zero and 100%. Further, you are well diversified and not exposed to the specific risk of a couple of individual stocks that have been talked up today but may be bankrupt tomorrow. Your actions are also not driven by emotion, an unreliable and disastrous friend in the financial markets that often causes people to buy overvalued stocks and then sell them at the bottom with a huge loss. Finally, you avoid all the chatter about GDP forecasts, geopolitics, the forthcoming inflection in interest rates and economic cycles, because the equity market anticipates the coming macro environment faster than the newspapers do. The biggest equity rallies started in economic recessions such as in 2009 and in 2020, when Covid-19 brought the world to a standstill.
Encouraging result
The switch strategy was activated four times in the last five years and posted a total performance of 77% including dividends, while the SMI, as mentioned earlier, managed 45%. Outperformance of 32% is very respectable, and with no need to go into complex methods of analysis or watch the market the whole time. This is just a starting set-up, which could be extended to include a range of filters to optimise the buying and selling points, for example, or divide positions into tranches. Why not have a go and throw the switch yourself!